Data Science Student Showcase Symposium

You are invited to the ASU Library's Unit for Data Science and Analytics virtual inaugural Student Showcase Symposium. Hear from students solving real-world problems.
Megan Gordon 1–1:30 p.m.
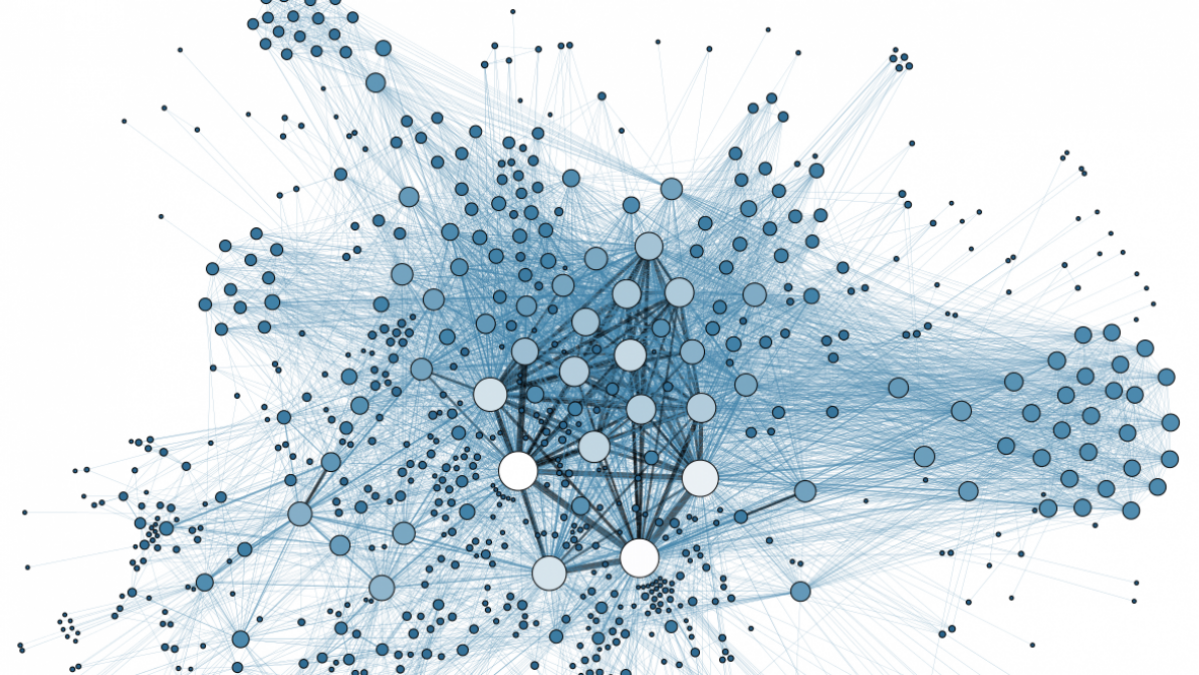
An organization's impact through connections: A topological approach
Does an organization make a difference? We will be answering this inquiry using a topological approach. We will measure an organization's impact on the surrounding business environment and individual members by looking at the graph topology.
Steve Jadav 1:30–2 p.m.
COVID-19 Data Browser: A web application for large-scale document search
Kaggle challenged its online community to develop data solutions that will help medical professionals keep up with the COVID-19 literature. The presenter will share how the COVID-19 Data Browser application was developed and its various features.
Crystal Nguyen 2–2:30 p.m.
Using Python to scale up the application of an industry suitability metric
The presentation will discuss an ongoing project that uses Python to scale up and implement a series of complex equations that capture the relationships between industries, occupations, employment levels and geographic locations. Using suitability index models helped to identify the relationship between industry match for a geographic location.
Pauras Jadhav 2:30–3 p.m.
Topic Modeling – Women of color exploration
Using Topic Modeling, we dove into various topics to find terms like 'women of color' and other intersectionality terms. This presentation will discuss the approach, the expected outcome and what really happened during the exploration.
Tanush Vinay 3–3:30 p.m.
Identifying Facebook posts of interest and classifying them into subtopics
When we deal with a huge noisy text corpus, we are often confused on how to skim it for our own use case and get an idea about the information embedded in it. This presentation will share our approach to skimming down our corpus and identify various subtopics within it – we didn’t get right the first time!
Marcus Garcia 3:30–4 p.m.
What is data science? What I thought I knew vs. reality
This presentation will walk through a personal experience of a data science Department of Navy, NavalX collaboration; from what you think will happen to what actually happens in data science. It will not always be bars and charts and graphs; and coding and programming. There is so much more.